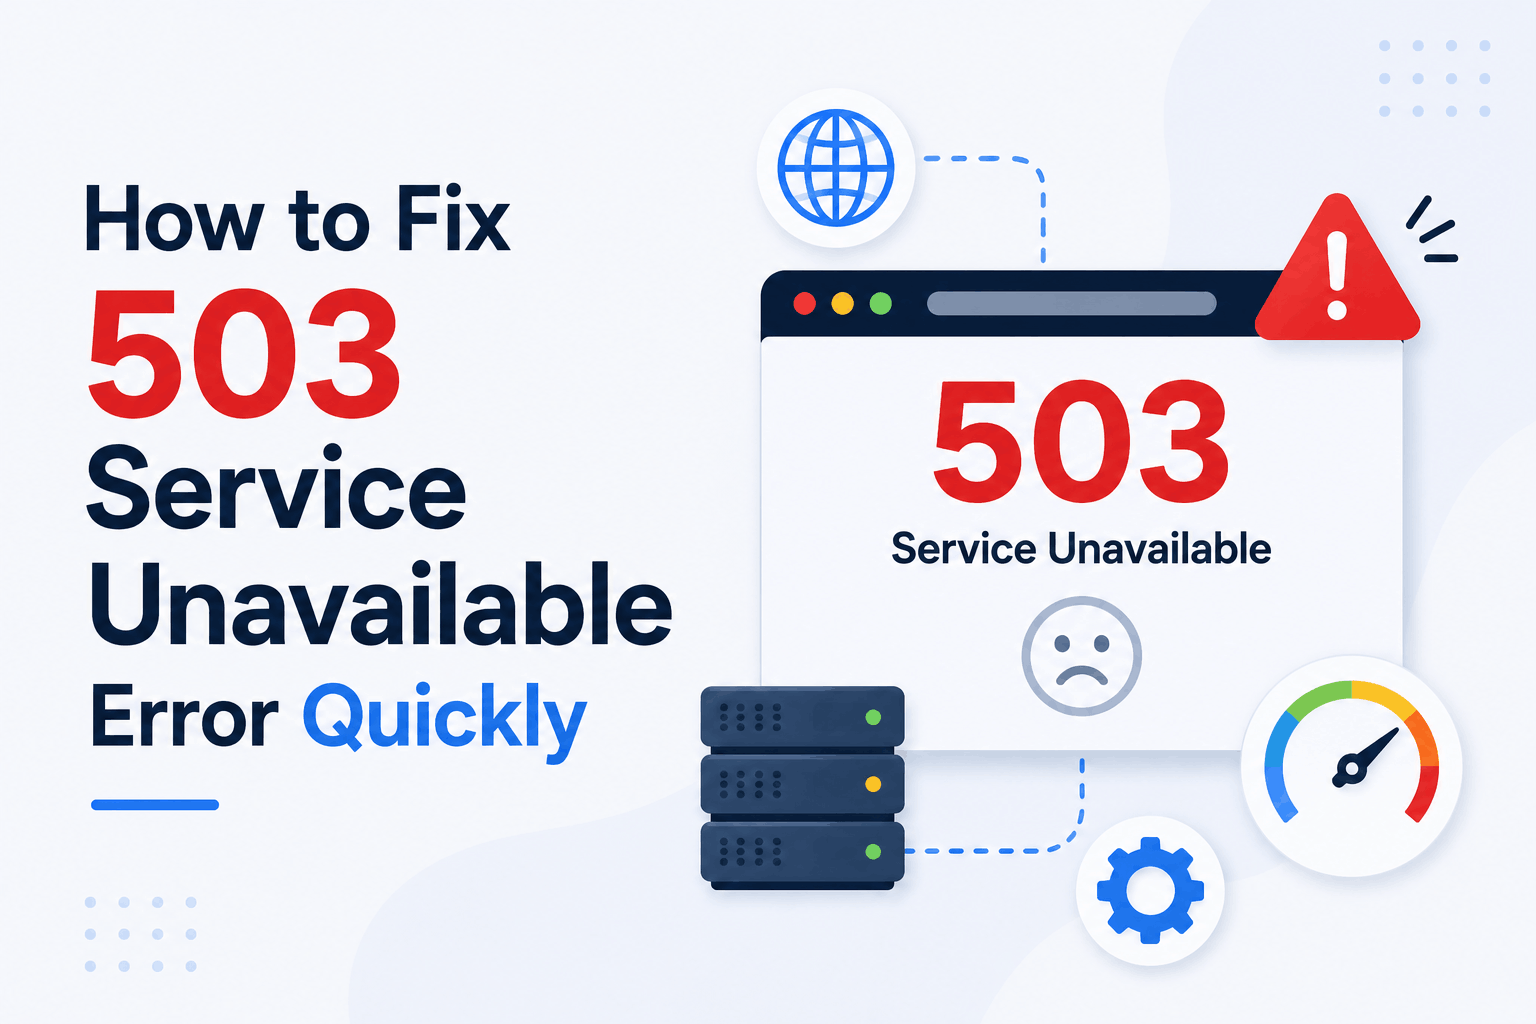
Your website is returning a 503 error. Visitors see a blank page or a message telling them the service is unavailable. Unlike a 404, which means a specific page is missing, a 503 means the entire server has temporarily stopped handling requests. The word temporarily is doing significant work in that sentence, because a 503 can last anywhere from five seconds during a WordPress update to several hours during a server crisis.
The key difference between a 503 and a 500 is intent. A 500 Internal Server Error means something crashed unexpectedly. A 503 Service Unavailable means the server is either deliberately offline for maintenance or genuinely unable to handle load right now. That distinction changes the fix completely. You do not restart a process to fix a 503 caused by a traffic spike. You do not reduce traffic to fix a 503 caused by a stuck .maintenance file.
This guide covers every known cause of a 503 error with its specific diagnosis and fix, ordered from the most common to the most technical. It covers WordPress-specific causes, Apache and Nginx configuration causes, CDN-related causes, and the Retry-After header that most guides ignore entirely but that matters for SEO and automated monitoring.
A 503 is always a server-side error. Visitors cannot trigger or fix it. If you are seeing it as a site owner, your server or application is the source. If you are seeing it as a visitor, the site is genuinely unavailable and refreshing after a minute is your only option.
What HTTP 503 Service Unavailable Actually Means
The HTTP specification defines a 503 response as one that indicates the server is currently unable to handle the request due to a temporary overload or scheduled maintenance. The RFC specifically notes that the server should send a Retry-After header indicating when the condition is expected to resolve.
In practice, 503 responses fall into three categories that require different responses. The first is a deliberate 503 triggered by maintenance mode, where the server is technically functional but is programmatically rejecting all requests while updates run. The second is an involuntary 503 from resource exhaustion, where the server has run out of PHP workers, database connections, memory, or CPU capacity to handle incoming requests. The third is a misconfiguration 503, where a server rule, proxy setting, or firewall is incorrectly blocking requests that should be allowed through.
| Error Code | Means | Server State | Fix Direction |
| 503 | Temporarily unavailable or overloaded | Running but refusing requests | Maintenance file, resource limits, process restart |
| 500 | Internal crash, generic failure | Running but crashed mid-execution | Error log, plugin isolation, .htaccess |
| 502 | Bad Gateway, upstream invalid response | Proxy cannot reach backend | PHP-FPM restart, proxy_pass config |
| 504 | Gateway Timeout, upstream too slow | Proxy reached backend but it timed out | Raise timeout values, optimize slow operations |
Every Cause of a 503 Error and How to Identify Each One
1. WordPress Stuck in Maintenance Mode
This is the most common cause of a 503 on WordPress sites. When WordPress runs an update for its core, a plugin, or a theme, it creates a file called .maintenance in the site root directory. While this file exists, WordPress returns a 503 to all visitors with the message Briefly unavailable for scheduled maintenance. Check back in a minute.
This works correctly under normal circumstances. The problem is when the update fails, times out, or the browser is closed mid-process. The .maintenance file is never deleted. The site sits in maintenance mode indefinitely and continues returning 503 for every request until someone manually removes the file.
| # Check if the maintenance file exists:
ls -la /var/www/html/.maintenance
# If it exists, delete it: rm /var/www/html/.maintenance
# Or via FTP / cPanel File Manager: # Look for a file named .maintenance in your WordPress root # It may be hidden — enable ‘show hidden files’ in your FTP client |
If you delete the .maintenance file while a genuine update is still running, you can corrupt the update. Only delete it if the update has clearly finished or failed. If a plugin update was the last action you took before the 503 appeared and it has now been more than 10 minutes, the update has failed and the file is safe to remove.
2. Server Overload: Too Many Requests, Too Few Workers
The second most common cause, particularly on shared hosting and underpowered VPS plans. When more simultaneous requests arrive than the server has PHP worker processes to handle, the server starts queuing them. When the queue fills up, it starts rejecting requests with a 503 rather than making visitors wait indefinitely.
On Apache with PHP-FPM, the relevant configuration is the pm.max_children setting in the PHP-FPM pool file. On shared hosting, you do not control this directly. Your host sets a process limit for your account and when you hit it, 503 errors appear. The log message that confirms this cause is:
| # In /var/log/php-fpm/error.log or php8.x-fpm.log:
server reached pm.max_children setting (5), consider raising it
# In /var/log/nginx/error.log: connect() to unix:/run/php/php8.2-fpm.sock failed (11: Resource temporarily unavailable)
# To check current PHP-FPM status (if access available): systemctl status php8.2-fpm # Or check the process count: ps aux | grep php-fpm | wc -l |
The fix for self-managed servers is to increase pm.max_children in your PHP-FPM pool configuration file, typically located at /etc/php/8.x/fpm/pool.d/www.conf. The correct value depends on available RAM. A rough calculation: divide your available RAM (minus operating system overhead) by the average memory consumed by a single PHP-FPM worker. On a 2GB VPS with 512MB reserved for the OS and Nginx, and workers averaging 50MB each, the maximum safe value is around 30.
| # /etc/php/8.2/fpm/pool.d/www.conf
pm = dynamic pm.max_children = 25 ; was 5 — increase based on available RAM pm.start_servers = 5 pm.min_spare_servers = 5 pm.max_spare_servers = 10 pm.max_requests = 500 ; recycle workers to prevent memory leaks
# After editing: systemctl restart php8.2-fpm |
On shared hosting where you cannot edit PHP-FPM configuration, contact your host and ask them to increase the PHP-FPM process limit for your account. If they refuse or the 503 errors persist under normal traffic loads, the hosting plan is undersized for your site and needs upgrading.
3. Backend Service Not Running
When a web server like Nginx or Apache is configured as a reverse proxy passing requests to a backend application such as PHP-FPM, Node.js, or Gunicorn, and that backend process has stopped, the web server returns 503 for every request because there is nothing to proxy to.
The error log confirms this immediately. In Nginx, the message is connect() failed (111: Connection refused) while connecting to upstream or no live upstreams while connecting to upstream. This means Nginx is running but the process it is trying to send requests to is not listening.
| # Check PHP-FPM status:
systemctl status php8.2-fpm
# If stopped, start it: systemctl start php8.2-fpm
# Check if Node.js app is running (if applicable): pm2 list pm2 restart all
# Check if Python app (Gunicorn) is running: systemctl status gunicorn systemctl restart gunicorn
# Verify the socket or port is actually listening: ss -tlnp | grep 9000 ; for PHP-FPM on port 9000 ls /run/php/php8.2-fpm.sock ; for PHP-FPM on Unix socket |
4. DDoS Attack or Sudden Traffic Spike
A distributed denial of service attack or an unexpected surge in legitimate traffic, from a viral social post or a mention in high-traffic media, can exhaust server resources exactly as a slow traffic overload does, but much more quickly and at much higher severity. The 503 appears because the server genuinely cannot process the volume of requests.
Distinguishing a DDoS from a traffic spike requires checking your server access logs for request patterns. A legitimate traffic spike shows a surge from diverse IP addresses requesting your actual content pages. A DDoS typically shows high volumes from specific IP ranges, requests to unusual URLs, or requests with abnormal User-Agent strings.
| # Count requests per IP in the last 1000 lines of access log:
tail -1000 /var/log/nginx/access.log | awk ‘{print $1}’ | sort | uniq -c | sort -rn | head -20
# Look for unusual request patterns: tail -500 /var/log/nginx/access.log | awk ‘{print $7}’ | sort | uniq -c | sort -rn | head -20
# If a DDoS is confirmed, block the top offending IP ranges: # In Nginx, add to server block or http block: # deny 203.0.113.0/24;
# Or use Cloudflare’s ‘Under Attack Mode’ if behind Cloudflare: # Dashboard > Overview > Under Attack Mode |
If a traffic spike is legitimate (your content went viral), the 503 is a capacity problem rather than an attack. Enable Cloudflare caching if not already active, as it will serve static assets from Cloudflare’s edge and dramatically reduce origin server load. For recurring spikes, upgrading the hosting plan or moving to a horizontally scalable architecture is the long-term fix.
5. Nginx Rate Limiting or Connection Limits
Nginx has built-in rate limiting and connection limiting features that return 503 when a client exceeds the configured threshold. These are intentional protections but can be misconfigured with thresholds that are too aggressive, blocking legitimate traffic. The Nginx error log clearly identifies when rate limiting is the cause:
| # In /var/log/nginx/error.log, look for:
limiting requests, excess: 1.2 by zone ‘one’ limiting connections by zone ‘perip’
# To check current rate limiting in Nginx config: grep -r ‘limit_req’ /etc/nginx/ grep -r ‘limit_conn’ /etc/nginx/
# Example: if limit_req_zone is set too aggressively: # limit_req_zone $binary_remote_addr zone=one:10m rate=1r/s; # Change rate to something more permissive: # limit_req_zone $binary_remote_addr zone=one:10m rate=30r/s;
# After editing Nginx config, test and reload: nginx -t systemctl reload nginx |
6. CDN or WAF Blocking Requests
When Cloudflare, Sucuri, or another CDN or Web Application Firewall sits in front of your origin server, it can return a 503 for several reasons: its connection to your origin server failed, your origin returned an error it could not handle, a WAF rule flagged the request, or the CDN itself is experiencing issues.
The fastest way to determine whether the CDN is the source of the 503 or simply relaying a 503 from your origin is to bypass the CDN temporarily and test the origin directly. For Cloudflare:
- Log into the Cloudflare dashboard for the affected domain
- Go to Overview, scroll to the bottom, and click Pause Cloudflare on Site
- Test whether the site loads directly without Cloudflare in the path
If the site loads after pausing Cloudflare, the problem is the connection between Cloudflare and your origin, not the origin itself. Common causes include your origin server’s firewall blocking Cloudflare IP ranges, an SSL mode mismatch between Cloudflare and the origin, or your origin server’s IP address having changed after a migration.
If the site still returns 503 after pausing Cloudflare, the problem is in the origin server and the causes covered in the other sections of this guide apply.
7. .htaccess Misconfiguration on Apache
On Apache-based servers, certain .htaccess configurations can produce 503 errors rather than the more commonly expected 500. This happens when a RewriteRule creates an infinite redirect loop, when a resource limit directive causes Apache to exhaust processing capacity, or when a required Apache module that a .htaccess directive depends on is disabled.
The diagnostic approach is the same as for a 500: rename the .htaccess file to .htaccess.bak via FTP and reload the site. If the 503 clears, a directive in the .htaccess file was the cause. Regenerate a clean .htaccess by going to WordPress Settings, then Permalinks, and clicking Save Changes.
8. Database Connection Exhaustion
WordPress and other PHP applications open MySQL connections to process every database-driven page request. MySQL servers have a max_connections setting that limits how many simultaneous connections it will accept. When this limit is reached, new connection attempts fail and PHP returns a 503 or a database connection error, depending on server configuration.
This is more common on high-traffic sites using shared database servers, or on sites with poorly optimized queries that hold connections open longer than necessary. Checking the MySQL error log and running a status query identifies whether this is the cause:
| # Check current MySQL connections:
mysql -u root -p -e ‘SHOW STATUS WHERE Variable_name = “Threads_connected”;’
# Check maximum connections setting: mysql -u root -p -e ‘SHOW VARIABLES LIKE “max_connections”;’
# Check if max was reached (Max_used_connections close to max_connections = problem): mysql -u root -p -e ‘SHOW STATUS LIKE “Max_used_connections”;’
# Temporary fix: increase max_connections in /etc/mysql/my.cnf: # [mysqld] # max_connections = 500
# Restart MySQL after changing: systemctl restart mysql |
WordPress-Specific 503 Fixes
Deactivating Plugins via FTP
When a 503 prevents access to the WordPress admin dashboard, you cannot deactivate plugins through the normal interface. The FTP method achieves the same result by making WordPress unable to find any plugins on disk:
| # Connect via FTP to your site root
# Navigate to wp-content/ # Rename the plugins folder: plugins -> plugins_OFF
# Reload the site. If the 503 clears: # Rename the folder back to ‘plugins’ # Then reactivate plugins one at a time from wp-admin/plugins.php # The 503 returns when you activate the problematic plugin |
Increasing PHP Memory and Execution Time
A 503 caused by a resource-heavy operation such as a WooCommerce product import, a WP All Import bulk operation, or a page builder save on a complex template can often be resolved by raising the PHP memory limit and maximum execution time:
| // In wp-config.php (add above the require_once line):
define(‘WP_MEMORY_LIMIT’, ‘512M’); define(‘WP_MAX_MEMORY_LIMIT’, ‘512M’);
// In .htaccess (Apache only): php_value memory_limit 512M php_value max_execution_time 300
// In php.ini: memory_limit = 512M max_execution_time = 300 |
Clearing All Caching Layers
A 503 that has already been fixed on the server can continue appearing to visitors if caching layers are serving the old error response. This affects page caching plugins, Cloudflare’s cache, and server-level caching from Varnish or Redis. Clear them in this order after resolving the underlying cause:
- WordPress caching plugin: WP Rocket, W3 Total Cache, or LiteSpeed Cache all have an empty all caches button in the WordPress toolbar
- Cloudflare: Dashboard, Caching, Configuration, Purge Everything
- Varnish (if present): sudo varnishadm ban req.url ‘~’ .
- Browser: hard refresh with Ctrl+Shift+R on Windows or Cmd+Shift+R on Mac
Server Configuration Fixes for Nginx and Apache
Nginx: No Live Upstreams
The error message no live upstreams while connecting to upstream in the Nginx error log means every server in the upstream block has failed its health check or is unreachable. This typically means the backend process (PHP-FPM, Node.js, Gunicorn) is not running. Beyond restarting the process, adding proper upstream health check and failover configuration prevents this from becoming a hard 503 in the future:
| # In your Nginx upstream block:
upstream backend { server 127.0.0.1:9000; keepalive 32; }
# In your location block, add fallback behavior: location / { proxy_pass http://backend; proxy_next_upstream error timeout http_503; proxy_read_timeout 120s; proxy_connect_timeout 30s; }
# Test and reload: nginx -t && systemctl reload nginx |
Apache: MaxRequestWorkers and Connection Limits
Apache returns a 503 when it has reached its maximum number of simultaneous request workers. The setting is MaxRequestWorkers in the Apache MPM (Multi-Processing Module) configuration. The default is 150 for the prefork MPM, which is adequate for low to medium traffic but insufficient for sites with persistent connections or high concurrency.
| # Find your Apache MPM configuration:
# /etc/apache2/mods-enabled/mpm_prefork.conf (prefork) # /etc/apache2/mods-enabled/mpm_event.conf (event)
<IfModule mpm_prefork_module> StartServers 5 MinSpareServers 5 MaxSpareServers 10 MaxRequestWorkers 150 ; increase if 503 under load MaxConnectionsPerChild 500 ; recycle workers to prevent memory leaks </IfModule>
# After editing: apachectl configtest systemctl restart apache2 |
The Retry-After Header: What Most Guides Skip
When a server returns a 503 for planned maintenance, the HTTP specification says the server should include a Retry-After header telling clients when to try again. Most implementations omit this entirely, which matters for two reasons.
First, search engine crawlers use the Retry-After header to understand whether a 503 is temporary and when they should re-crawl. Without a Retry-After header, Google and Bing treat a 503 as an unspecified temporary error and apply their default retry logic, which may not align with your maintenance window.
Second, monitoring services and API clients that respect the header will back off and retry at the indicated time rather than hammering the server with retry requests during the maintenance window.
To add a Retry-After header to your maintenance response in Nginx:
| # During planned maintenance in Nginx:
location / { return 503; }
error_page 503 /maintenance.html;
location = /maintenance.html { root /var/www/html; internal; add_header Retry-After 3600; ; retry in 3600 seconds (1 hour) } |
The Retry-After value can be either a number of seconds or an HTTP-date string indicating the exact time the service will be available. Using an HTTP-date (for example, Retry-After: Mon, 26 May 2026 14:00:00 GMT) is more precise for maintenance windows of known duration.
503 Errors and SEO: What Actually Happens to Your Rankings
A 503 error handled correctly has minimal lasting SEO impact. A 503 handled incorrectly can cause pages to drop from the index and rankings to fall for weeks after the error is resolved.
Google’s John Mueller has confirmed publicly that Googlebot treats a 503 as a signal that the content is temporarily unavailable and will retry crawling. For brief outages under a few hours, Google typically caches the last successful crawl and retries on its next scheduled crawl. The page does not drop from the index immediately.
The problems start when a 503 persists. After 24 to 48 hours of continuous 503 responses, Googlebot starts reducing its crawl frequency for the site. After several days, affected pages accumulate crawl errors in Google Search Console and may start dropping from ranking positions. After a week or more of continuous 503s, pages can be removed from the index entirely.
Three actions protect your SEO during any extended 503 period. First, implement the Retry-After header as described above, signaling to Googlebot that the condition is temporary. Second, serve a proper 503 HTTP status code rather than a 200 OK response with error content, which some misconfigured maintenance pages do and which causes Googlebot to index the error page itself. Third, check Google Search Console after the 503 is resolved and use the URL Inspection tool to request re-indexing of affected pages.
A 503 response code is specifically designed for temporary unavailability. Using a 200 status code for a maintenance page, which happens when page builders or caching plugins generate maintenance screens without setting the HTTP status, is worse for SEO than a genuine 503. Google indexes the 200 maintenance page and replaces your real content in search results.
Setting Up Monitoring So You Know in Minutes, Not Hours
Most site owners discover a 503 error when a customer complains, an employee cannot access the site, or revenue reports show an unexplained gap. By then, the outage may have run for hours. An uptime monitor that checks your site every few minutes and sends an immediate alert changes the response time from hours to minutes.
Free options include UptimeRobot, which monitors up to 50 URLs at 5-minute intervals and sends alerts via email, SMS, or Slack. Freshping offers 50 monitors at 1-minute intervals on its free plan. Both are adequate for most sites. Paid options like Better Uptime, Site24x7, and Pingdom add incident management workflows, status page generation, and on-call scheduling.
Beyond basic uptime monitoring, configuring your web server to log and alert on sustained 503 rates is more actionable for technical teams. Nginx and Apache both support logging 503 responses to separate log files with custom alert scripts or log monitoring tools like GoAccess, Grafana with Loki, or Datadog.
Preventing 503 Errors Before They Affect Visitors
Right-size the hosting plan before you need to
Shared hosting plans that were adequate at launch become insufficient as traffic grows. The 503 errors that appear during peak traffic or after a viral moment are the site telling you the hosting plan has reached its capacity ceiling. Monitoring CPU usage, memory consumption, and PHP worker utilization through your hosting control panel gives early warning before the 503 errors start. A consistent pattern of reaching 80% of resource limits under normal traffic is a signal to upgrade before the next spike pushes you over.
Always update plugins and themes on a staging site first
The .maintenance file scenario accounts for a significant share of 503 errors on WordPress sites, and most of them happen because a plugin update introduced a conflict or a bug that caused the update to fail or timeout. Testing updates on a staging copy of the site before applying them to the live site eliminates this cause almost entirely. Every managed WordPress host provides one-click staging environments. WP Staging and Duplicator create staging copies on shared hosting where the host does not provide them natively.
Configure pm.max_requests to prevent worker memory leaks
PHP-FPM workers accumulate memory over time due to minor memory leaks in plugins, themes, and the PHP runtime itself. A worker that started at 40MB may grow to 120MB after thousands of requests. As workers grow, more memory is consumed per worker, fewer workers can run simultaneously, and the pm.max_children ceiling is reached at lower traffic levels. Setting pm.max_requests to 500 causes each worker to gracefully recycle after 500 requests, freeing accumulated memory and keeping per-worker consumption stable over time.
Implement a proper maintenance page with the correct HTTP status
When you need to take a site offline for maintenance, serve a 503 status code with a Retry-After header and a user-friendly maintenance HTML page rather than leaving the server returning error responses with no explanation. This keeps Googlebot properly informed, gives visitors a clear message, and allows your monitoring system to distinguish between an unplanned outage and a planned maintenance window.
Frequently Asked Questions
What is a 503 Service Unavailable error?
A 503 Service Unavailable is an HTTP status code that means the server is currently unable to handle incoming requests. It is intended to be a temporary condition, in contrast to a permanent error. The server is technically running and can communicate, but it is either deliberately offline for maintenance, has exhausted its capacity to handle the current request volume, or the backend application it relies on has stopped responding. It differs from a 500 Internal Server Error, which indicates a crash, and from a 502 Bad Gateway, which indicates a proxy could not reach its upstream.
How do I fix a 503 error on my WordPress site?
Start by checking for a stuck .maintenance file in your WordPress root directory via FTP and deleting it if it exists. If that is not the cause, check your server error logs via cPanel under Metrics then Errors, or via SSH at the Apache or Nginx error log path. If the logs show PHP-FPM worker exhaustion, restart the PHP-FPM service. If the logs show a plugin file causing a crash, rename the wp-content/plugins folder via FTP to disable all plugins and identify the conflict by reactivating them one at a time. If you are on shared hosting and the error appears under normal load, contact your host to check whether your account has hit its resource limits.
How long does a 503 error last?
A 503 caused by a stuck WordPress .maintenance file lasts until the file is manually deleted, which could be minutes or days depending on when someone discovers the problem. A 503 from a traffic spike on shared hosting typically resolves in minutes as the spike subsides. A 503 from a crashed process lasts until the process is restarted. A 503 from a resource limit on a hosting plan that is consistently undersized will recur regularly until the plan is upgraded or resource consumption is reduced. There is no automatic resolution for most 503 causes.
Does a 503 error hurt my Google rankings?
A brief 503 lasting under a few hours has negligible impact on rankings, because Googlebot treats it as a temporary condition and retries. A 503 persisting for 24 hours or more starts accumulating crawl errors in Google Search Console and weakens ranking signals for affected pages. After several days, pages may begin losing positions. After a week or more, pages can be temporarily removed from the index. Recovery after resolving the error requires submitting affected pages for re-indexing via the URL Inspection tool in Google Search Console. Serving a 503 with a Retry-After header during planned maintenance communicates to Google that the outage is intentional and temporary, which reduces crawl impact.
What is the difference between a 503 and a 502?
A 502 Bad Gateway means a proxy or gateway server received an invalid or empty response from the server sitting behind it. A 503 Service Unavailable means the server itself is refusing to handle requests, either because it is overloaded or in maintenance. In practice: a 502 usually means restart the backend process or fix the proxy configuration. A 503 usually means the server is genuinely overwhelmed, a process limit has been reached, or maintenance mode is active. They can look identical to visitors but require different fixes.
How can I tell if a 503 is caused by a DDoS attack or a traffic spike?
Check your server access logs for request patterns. Run tail -1000 /var/log/nginx/access.log and look for an unusual concentration of requests from specific IP address ranges, requests to non-existent URLs, requests with blank or unusual User-Agent strings, or an unusually high rate of POST requests. A legitimate traffic spike shows diverse IPs requesting real content pages. A DDoS shows concentrated sources, unusual paths, or abnormal request patterns. Cloudflare’s analytics dashboard provides the fastest visual way to distinguish the two if you are behind Cloudflare.
Can a 503 error be caused by a plugin in WordPress?
Yes. A plugin that consumes excessive memory, triggers a fatal PHP error during initialization, creates an infinite loop during processing, or exhausts available PHP worker connections can produce a 503. This is most common immediately after a plugin update that introduced a bug or an incompatibility with the current PHP version or WordPress version. The FTP plugin isolation method, renaming the plugins folder to disable all plugins at once, is the fastest way to confirm a plugin is the cause.
What is the Retry-After header and should I use it?
Retry-After is an HTTP response header that tells clients, including search engine crawlers and monitoring services, when they should retry a request that received a 503 response. It can be a number of seconds or an HTTP-formatted date and time. Including it with any intentional 503 response during planned maintenance is good practice for two reasons: it signals to Googlebot that the downtime is planned and temporary, reducing the likelihood of crawl errors accumulating, and it prevents automated clients from retrying immediately and adding unnecessary load to the server during the maintenance window.