
Cyber insurance was supposed to be the financial safety net that every business could rely on after a breach. Yet in 2026, over 40 percent of businesses that file a claim receive no payout. Premiums that fell sharply in 2024 and 2025 are now forecast to rise by 15 to 20 percent over the next 12 months. And the global market, worth just over $26 billion today, is on course to reach $223 billion by 2034.
This statistics resource covers everything a CFO, CISO, risk manager, or small business owner needs to understand about the state of cyber insurance in 2025 and 2026, including market size, claim volumes, denial rates, the exact reasons insurers refuse to pay, premium trend data broken down by industry, and what the requirements look like heading into 2026.
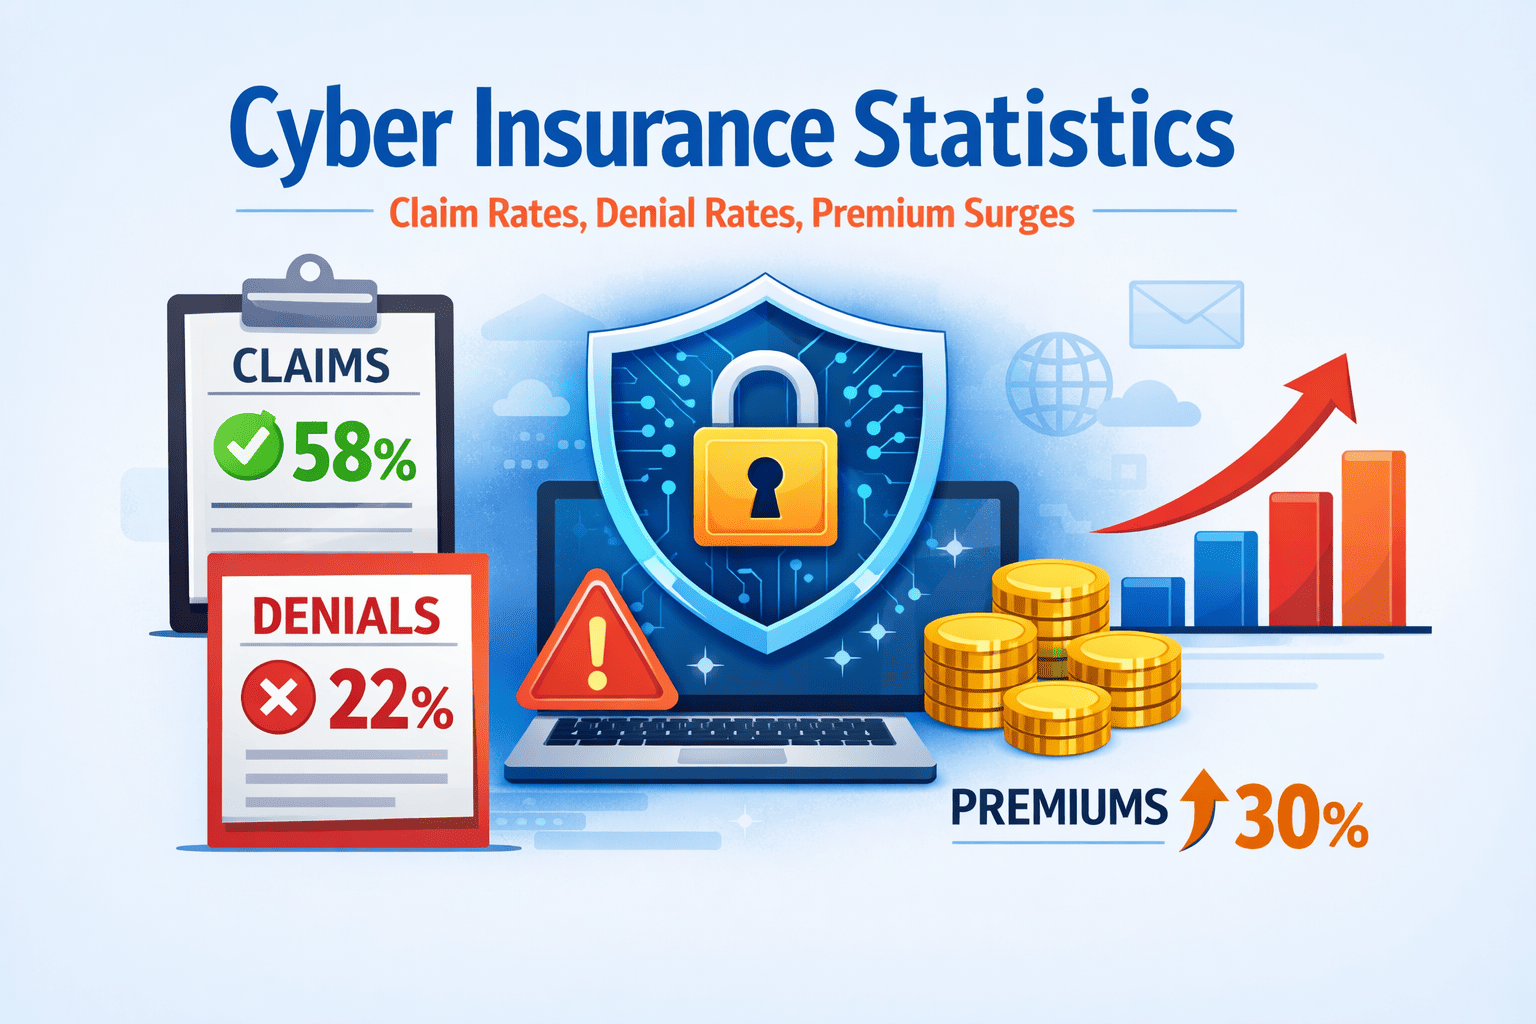
Key Statistics at a Glance
| Metric | Statistic (2025 and 2026) |
| Global cyber insurance market size (2025) | $26.25 billion (Fortune Business Insights) |
| Projected market size by 2034 | $223.47 billion at 27% CAGR |
| Claims denial rate | Over 40% of filed claims denied (Fitch, Slingshot) |
| Claims denied due to missing MFA | 82% of denied claims involved no MFA (Coalition 2024) |
| Average claim amount for SMEs | $205,000 (Arctic Wolf 2025) |
| Average claim for a large business | $228,000 (DeepStrike 2025) |
| Premium change in 2025 vs 2024 | Down 6% in 2025; down 22% from 2022 peak (Swiss Re) |
| Premium forecast for 2026 | Up 15 to 20% (S&P Global Ratings) |
| Ransomware share of claims | 41% of all cyber insurance claims (Munich Re) |
| SMEs without cyber insurance | 72% of SMEs still uninsured despite high risk (Sci-Tech Today) |
| Businesses with coverage (UK) | 62% in 2025, up from 49% in 2024 (UK Gov Survey) |
| Cyber insurance ROI estimate | 19% ROI for a business with 500M EUR revenue (Howden 2025) |
Cyber Insurance Market Size Statistics
The cyber insurance industry has grown at a pace that few financial sectors have matched. Starting from a niche product written for early internet companies in the late 1990s, the market now represents one of the most dynamic corners of global insurance.
| $26.25B | Global cyber insurance market size in 2025 (Fortune Business Insights) |
| $223.47B | Projected market size by 2034, growing at a 27% compound annual growth rate |
| $33.05B | Projected market size in 2026, a 26% increase over the 2025 figure |
The growth story has several distinct phases worth understanding:
From 2017 to 2022, global cyber insurance premiums grew by more than 30 percent annually, driven by the explosion of ransomware attacks and increasingly costly data breaches. That period saw insurers sometimes double premiums at renewal, and many businesses struggled to obtain coverage at all.
From 2022 to 2025, growth slowed dramatically to roughly 5 percent per year. Swiss Re reported this deceleration as a direct result of market maturation: favorable loss ratios had attracted an influx of new capital and new carriers, driving competition that pushed premiums downward. By 2025, premiums were approximately 6 percent lower than 2024 levels and 22 percent below the 2022 peak.
| Key context: The first-ever decline in US direct written premiums was recorded in 2024, with a 2.3% drop tracked by the National Association of Insurance Commissioners (NAIC). This was not a sign of reduced demand or lower risk; it was a reflection of intense competition among carriers. |
Market concentration remains heavily weighted toward North America, which accounted for 36.4 to 37.6 percent of global premiums in 2025. The Banking, Financial Services and Insurance sector (BFSI) holds the largest share of any single industry at 28.3 percent of the market. Healthcare is projected to record the highest growth rate of any sector through 2034.
The Asia Pacific region is identified by analysts as the fastest-growing regional market going forward, as regulatory developments and rising cybercrime rates increase awareness among businesses that historically underinvested in cyber risk transfer.
Cyber Insurance Adoption Statistics
Despite the market’s growth, adoption remains far from universal. The gap between large enterprises and small businesses is particularly striking, and it is a gap that cybercriminals are well aware of.
| Business Size | Revenue Range | Cyber Insurance Adoption Rate |
| Large corporates | $1 billion or more | 60 to 70% (Swiss Re) |
| Mid-market firms | $100 million to $1 billion | 40 to 50% (Swiss Re) |
| Small and medium businesses | $10 million to $100 million | 10 to 20% (Swiss Re) |
| Micro businesses | Below $10 million | 5 to 10% (Swiss Re) |
In the United Kingdom, a government-backed survey found somewhat higher adoption numbers, with 62 percent of small businesses reporting some form of cyber insurance in 2025, up from 49 percent in 2024. Medium-sized businesses in the UK reported 65 percent coverage. Notably, only 53 percent of large UK businesses said they had cyber insurance, which the survey attributed partly to self-insurance arrangements at the enterprise level.
Globally, only 47 percent of eligible organizations carry a cyber insurance policy, according to Arctic Wolf research from August 2025. That figure points to a substantial underserved portion of the market: the majority of businesses that could benefit from coverage do not yet hold it.
| Real-world consequence: Marks and Spencer disclosed a 324 million GBP hit to operating profit following a 2025 cyberattack but was expected to recover more than 100 million GBP through its cyber insurance program. Competitor Co-op, which had not purchased cyber insurance, disclosed 120 million GBP in lost profit with no insurance recovery. Jaguar Land Rover, similarly uninsured at the time of a September 2025 attack affecting three manufacturing facilities, bore the entire financial impact directly on its financial statements. |
3. Cyber Insurance Claim Statistics
Understanding what drives claims, how much they cost, and which businesses are most exposed is essential for risk managers, underwriters, and business owners who want to understand whether their coverage will actually protect them.
Claim Volume Trends
The frequency of cyber insurance claims dropped significantly in the first half of 2025. Allianz reported that claim severity among its customers declined by more than 50 percent in H1 2025, with large loss claims over 1 million EUR dropping by 30 percent. US insurer CyberResilience reported a 53 percent drop in claims frequency over the same period. Coalition reported a smaller but still notable 7 percent decrease.
However, the picture is not straightforwardly positive. CyberResilience also reported that for successful attacks, the average claim value rose 17 percent compared to 2024. Criminals are filing fewer but more damaging attacks, concentrating their efforts on higher-value targets and investing more heavily in techniques that evade detection and maximize damage before triggering a claim.
What Drives Claims
Ransomware remains the single most expensive claim type. The breakdown of claim types by frequency and cost tells a nuanced story:
| Claim Type | Share of Total Claims | Average Loss per Incident |
| Business Email Compromise (BEC) and Fund Transfer Fraud | 60% combined (DeepStrike 2025) | $45,000 to $150,000 |
| Ransomware | 18% of claims; 41% of total payout value (Munich Re) | $292,000 per incident (DeepStrike) |
| Data breach and notification costs | Significant share across all sectors | $4.88 million average (IBM 2025) |
| Phishing incidents including BEC | Second most common claim type (JumpCloud) | Varies by severity |
| Supply chain and third-party compromise | 35.5% of all data breaches in 2024 (NAIC) | Often exceeds $100 million for large incidents |
| $292K | Average ransomware loss per incident for insured businesses in 2025 (DeepStrike) |
| $4.88M | Global average cost of a data breach in 2025 (IBM Cost of a Data Breach Report) |
| $10.93M | Average data breach cost in the healthcare sector, the highest of any industry |
Claim Costs by Business Size
The size of a business significantly influences both the frequency and cost of cyber insurance claims:
- Small businesses: average claim of $79,000 in 2025 (DeepStrike). For a micro-enterprise, this can represent an existential financial threat.
- SMEs overall: average claim amount of $205,000 (Arctic Wolf). SMEs make up the majority of claims by volume.
- Large businesses: average claim of $228,000. While higher in absolute terms, this is a much smaller fraction of revenue.
- Organizations using 24×7 SOC or MDR services: median claim value of $75,000. Those relying on endpoint security alone saw median claims of $3 million.
Industry Sector Claims Breakdown
Not all sectors face equal exposure. Manufacturing led claim volumes in 2025 according to Allianz data, a consequence of the sector’s 71 percent increase in cyberattacks and the rapid digitization of operational technology systems.
| Industry | Share of Large Claims (2025) | Notable Risk Factor |
| Manufacturing | 33% of all large claims (Allianz) | OT digitization; 71% rise in attacks |
| Financial Services | Combined 33% with manufacturing for large claims | Average breach cost of $5.97M (GDPR, GLBA exposure) |
| Professional Services and Consulting | 18% of large claims (Allianz) | High-value client data exposure |
| Healthcare | Highest per-breach cost at $10.93M average | Legacy systems, zero tolerance for downtime |
| Retail | 23.87% market share projection in 2026 (Fortune BI) | Third-party supply chain exposure |
Cyber Insurance Claim Denial Statistics
This section covers territory that most statistics blogs ignore entirely: the denial side of cyber insurance. It is arguably the most important data for any business relying on a policy as its financial backstop.
| 40%+ | Cyber insurance claims denial rate in 2024 and 2025 (Fitch Ratings, Slingshot IS) |
| 44% | Share of claims denied specifically due to lack of evidence or documentation (Orbis Solutions) |
| 82% | Proportion of denied claims involving organizations without multi-factor authentication (Coalition 2024) |
The Top Reasons Cyber Insurance Claims Are Denied
The reasons claims are rejected have become increasingly systematic. Insurers are no longer making case-by-case judgment calls as often; they are applying documented security checklists and policy conditions with significant rigor. Here is the breakdown:
| # | Denial Reason | Frequency | Source |
| 1 | Missing or inadequate security controls (no MFA, no EDR, no patching) | 26% of denials; 32% per carriers specifically (Help Net Security) | Arctic Wolf 2025, Coalition 2024 |
| 2 | Financial instability or failure to provide required application information | 21% of denials each (Help Net Security) | Arctic Wolf 2025 |
| 3 | Misrepresentation on the application | Top reason per medium.com JSOC analysis | Multiple industry sources |
| 4 | Delayed incident reporting (outside 48 to 72 hour window) | Common; exact denial trigger in many policy documents | ASi Networks 2025, multiple carriers |
| 5 | Policy exclusions (war, nation-state attacks, poor security) | NotPetya-class war exclusions well documented | Lloyd’s, Munich Re policy wording |
| 6 | Third-party vendor breach without explicit coverage endorsement | AME Group analysis 2025 | Growing as supply chain attacks rise |
| 7 | Ransomware sub-limits below actual demand | Common in older or budget policies | Medium JSOC 2025, MonrealIT 2026 |
The MFA Problem in Detail
Multi-factor authentication has become the single most important determining factor between a paid claim and a denied one. According to Marsh McLennan’s 2025 Cyber Insurance Market Report, 99 percent of cyber insurance applications now include specific questions about MFA implementation. Coalition’s 2024 data found that 82 percent of denied claims involved organizations without MFA.
The catch that many businesses miss is that insurers do not merely want confirmation that MFA has been purchased or is available. They require documented proof that MFA is enforced across every email account, VPN connection, remote access gateway, cloud platform, and all administrative accounts. A municipality had an $18.3 million claim denied explicitly because MFA was not fully implemented across all systems at the time of the attack, despite having it active on most accounts.
| Underwriter perspective: AI-driven underwriting platforms now scan public-facing assets and compare what they find against what the applicant claimed on their application. If an organization stated MFA was implemented everywhere, but an external service does not enforce it, that discrepancy is grounds to deny a claim on misrepresentation grounds, even if the policy was issued in good faith. |
War Exclusions and the Nation-State Problem
The so-called war exclusion has become a significant issue as nation-state-backed cyberattacks grow more common. The 2017 NotPetya attack, attributed to Russian military intelligence, resulted in over $10 billion in global damage. Companies including Merck and Mondelez International sought combined payouts of over $1.4 billion from their insurers, who invoked war exclusions to deny or limit coverage.
By 2025, the language around war and nation-state exclusions has evolved significantly. Lloyd’s of London updated its market requirements to formally exclude losses from state-backed cyberattacks in many standalone policies. Businesses in critical infrastructure sectors, financial services, and defense supply chains face the greatest exposure from this exclusion gap.
Cyber Insurance Premium Statistics and Trends
Premium pricing has gone through a dramatic cycle over the past six years, and understanding that cycle is essential for finance teams budgeting for 2026 renewals.
The Premium Cycle in Numbers
| Period | Premium Trend | Key Driver |
| 2017 to 2022 | Over 30% annual growth; some renewals saw 100 to 200% increases | Ransomware surge, underpriced early policies |
| 2022 to 2024 | Deceleration to approx. 5% annual growth | Market competition, improved security posture |
| 2024 | First-ever US direct written premium decline of 2.3% (NAIC) | Carrier competition, stabilizing loss ratios |
| 2025 | Down a further 6%; 22% below 2022 peak (Swiss Re) | Soft market conditions, favorable loss ratios |
| 2026 forecast | Up 15 to 20% (S&P Global Ratings) | Rising claims severity, new threat vectors |
What Determines Your Premium in 2026
Premium pricing is no longer a function of company size alone. Insurers have developed sophisticated risk scoring models that evaluate security posture in detail. The eight controls that carriers now consistently underwrite against are:
- Multi-factor authentication: enforced across email, VPN, remote access, cloud, and admin accounts
- Endpoint detection and response (EDR): traditional antivirus is no longer accepted; active behavioral monitoring required
- Email security: filters beyond basic spam detection, including DMARC, DKIM, and DMARC enforcement
- Tested and isolated backups: immutable backups stored separately from production; regular restore testing documented
- Incident response plan: written, tested, and current; insurers ask for evidence of tabletop exercises
- Employee security training: documented annual training programs, phishing simulation results
- Privileged access management: least-privilege access, separate admin accounts, documented PAM process
- Patch management: documented patching schedule; critical patches applied within 30 days
Organizations that demonstrate maturity across all eight controls have historically received premium stabilization or even reductions of 50 to 60 percent compared to businesses with weak security postures. Small business premiums for $1 million in coverage typically range from $1,000 to $7,500 annually depending on industry and security documentation, according to Marsh McLennan’s 2025 report.
| 50 to 60% | Premium reduction possible for organizations demonstrating strong, documented security controls |
| 30 to 50% | Premium increase businesses without adequate controls can expect at 2026 renewal (Facet Technologies) |
Industry Sector Premium Variations
Sector matters significantly for premium pricing. Businesses in healthcare and financial services paid premiums 50 percent higher than the market average in 2023 and 2024, a gap that has continued into 2025. Ransomware-specific coverage has historically seen the steepest hikes, with some policies recording 45 percent year-over-year increases during the hard market of 2021 and 2022.
The Threat Landscape Driving Claims in 2025 and 2026
Cyber insurance statistics do not exist in a vacuum. Understanding what is driving claims requires understanding the threats that underwriters are pricing against and that businesses are actually experiencing.
Ransomware Statistics
| 126% | Increase in ransomware incidents in Q1 2025 compared to Q1 2024 (KY3 citing industry data) |
| $265B | Projected annual global ransomware losses by 2031 (MIS Solutions citing industry forecasts) |
Ransomware accounts for 41 percent of all cyber insurance claims by volume and an even larger share by total payout value. The average ransomware loss per insured incident in 2025 was $292,000. In 72 percent of ransomware incidents, attackers specifically targeted backups before triggering encryption, which is why insurers now require immutable, isolated backup systems as a coverage condition.
The ransom payment issue has also grown more complex. Some policies cap ransomware reimbursements well below actual demand, leaving businesses to cover remaining costs out of pocket. A policy with $5 million total coverage may include only $500,000 specifically for ransomware payments, while recovery, notification, legal fees, and business interruption costs from the same incident often run $4 to $6 million.
Credential Theft and Infostealer Statistics
| 800% | Increase in stolen credentials in H1 2025, with 1.8 billion credentials compromised by infostealers (Flashpoint via NAIC) |
The explosion of credential theft via infostealer malware has created a direct link between dark web exposure and cyber insurance claims. Research cited in the NAIC’s 2025 Cybersecurity Insurance Market Report found that organizations with any data or mention on the dark web are statistically more likely to suffer a cyberattack and file a claim. Insurers are beginning to incorporate dark web monitoring data into underwriting decisions as a predictive risk signal.
AI-Powered Attack Statistics
Artificial intelligence has materially changed the cost and efficiency of cyberattacks. Vishing (voice phishing) surged 442 percent in 2024 according to the NAIC report. AI-generated phishing emails achieve significantly higher engagement rates than traditional attempts, and deepfake-enabled fraud has produced documented losses including the $25.6 million Arup incident where finance staff were deceived by AI-generated video calls impersonating company executives.
Fifty percent of businesses now leverage AI-driven security tools specifically to qualify for better insurance premiums, according to Delinea research cited by JumpCloud. This arms race between AI-powered attacks and AI-assisted defenses is increasingly central to underwriting conversations.
Supply Chain Attack Statistics
| 35.5% | Share of all data breaches originating from third-party compromises in 2024 (NAIC) |
Third-party and supply chain compromise accounted for 35.5 percent of all data breaches in 2024. Retail, hospitality, technology, and energy sectors saw over 45 percent of their breaches linked to third-party vendors. Coverage for these incidents is often limited or absent in standard policies unless specific endorsements are purchased, which is a significant gap given the trajectory of this attack type.
Website Security, SSL Certificates, and Cyber Insurance
For businesses assessing their cyber insurance eligibility and premium pricing, website security controls including SSL certificate management are increasingly part of underwriter conversations. Here is what the data shows.
Expired SSL certificates are a surprisingly common trigger for both security incidents and business interruption claims. Insurers assessing risk posture look at certificate lifecycle management as an indicator of overall security maturity. Organizations that cannot demonstrate active monitoring of certificate expiry are often treated as higher-risk applicants.
Phishing sites now routinely obtain free SSL certificates to display the padlock icon in browsers, creating a false sense of security for users. According to the Anti-Phishing Working Group, over 80 percent of phishing sites use HTTPS. This has made the argument that a padlock alone signals trust obsolete, and it has informed insurers’ views on browser-based user education and security training requirements.
From a practical standpoint, businesses using SSL certificates on customer-facing sites and internal systems should ensure certificate expiry monitoring is documented and demonstrable to underwriters. Tools that automate certificate renewal and provide audit logs are increasingly viewed favorably during the underwriting process.
Cyber Insurance Requirements in 2026: What Businesses Need to Qualify
The requirements to obtain and maintain cyber insurance coverage are substantially more demanding in 2026 than they were even two years ago. Businesses that do not meet these controls face three potential outcomes: outright denial of coverage, exclusion of key incident types (particularly ransomware), or claims denial after a breach.
| The shift is fundamental: Insurers have moved from asking ‘Do you have security?’ to ‘Prove it, continuously.’ The application process for many carriers now involves external scanning of public-facing assets, log retention verification, and documentation review, not just yes-or-no questionnaires. |
Non-Negotiable Requirements Across Major Carriers
| Control | Carrier Expectation | Consequence of Non-Compliance |
| Multi-factor authentication | Enforced on all email, VPN, remote access, cloud, and admin accounts; SMS-based MFA often insufficient | Claim denial; $18.3M municipality claim denied for partial MFA (MonrealIT 2026) |
| Endpoint Detection and Response (EDR) | Required on all endpoints; behavioral monitoring, not just known-malware blocking | Higher premiums; possible coverage exclusions |
| Email security | DMARC enforcement, anti-phishing filtering, business email compromise protection | Increased premium; BEC claims scrutinized |
| Immutable, isolated backups | 72% of ransomware attacks target backups; restore tests must be documented | Ransomware coverage excluded or sub-limited |
| Incident response plan | Written, tested, and current; 48 to 72 hour notification window required | Delayed reporting triggers automatic denial in many policies |
| Employee security training | Annual documented training; phishing simulation results retained | Application accuracy scrutinized; claim denial risk if staff training overstated |
| Privileged access management | Least-privilege, separate admin accounts, documented PAM process | Elevated risk rating; higher premiums |
| Patch management | Critical patches within 30 days; internet-facing systems prioritized | Vulnerability exploit claims scrutinized (30% of ransomware via exploits, Sophos 2025) |
Frequently Asked Questions
Is cyber insurance worth it for small businesses?
The data strongly suggests yes, with important caveats. The average cyber incident cost for an uninsured small business exceeds $79,000, which is a potentially terminal event for a business with tight margins. Howden’s 2025 analysis estimated a 19 percent ROI on cyber insurance for businesses that experience a claim. The critical qualification is that coverage must be obtained correctly: policies must match actual risk exposure, security controls must be genuinely implemented and documented, and incident response procedures must be in place before a breach occurs.
What is the most common reason cyber insurance claims are denied?
Based on data from multiple industry sources in 2025, the most common reason is missing or inadequate security controls, particularly multi-factor authentication. Coalition’s 2024 data found that 82 percent of denied claims involved organizations without MFA fully implemented. Closely related is misrepresentation on the application: businesses often answer security questions optimistically, only for post-breach investigation to reveal that stated controls were not fully in place.
Why are cyber insurance premiums expected to rise in 2026?
S&P Global Ratings forecast a 15 to 20 percent premium increase in 2026 following two years of declining rates. The drivers include rising claims severity (successful attacks are 17 percent more costly per incident than in 2024), the 126 percent increase in ransomware incidents in Q1 2025, the 800 percent surge in infostealer-driven credential theft, and the growing impact of AI-powered attacks that evade traditional defenses. Insurers that allowed loss ratios to compress during the soft market are recalibrating pricing to reflect the evolving risk environment.
Can a nation-state cyberattack claim be denied?
Yes. War exclusions in cyber insurance policies were invoked in the NotPetya litigation involving Merck and Mondelez, and the language around nation-state exclusions has tightened since. Lloyd’s of London market guidance now requires explicit exclusion of losses from state-backed attacks in many policy forms. Businesses in sectors that are frequent targets of nation-state actors including critical infrastructure, financial services, and defense supply chains should review their policy wording carefully and seek specific coverage endorsements if available.
How can a business reduce its cyber insurance premium?
The most effective actions, in order of impact based on available underwriting data, are: (1) implementing and fully documenting MFA across all accounts and systems; (2) deploying EDR on all endpoints; (3) establishing and testing an incident response plan; (4) implementing immutable, isolated backups with documented restore testing; and (5) maintaining a documented patch management program. Organizations that complete all five steps have seen premiums stabilize or fall 50 to 60 percent compared to businesses without these controls.
Summary: What the Data Tells Us About Cyber Insurance in 2026
The cyber insurance market in 2026 presents a paradox. The product is more important than ever: a $26 billion industry serving a world where data breach costs average $4.88 million, ransomware incidents have jumped 126 percent, and credential theft is up 800 percent. Yet over 40 percent of claims are denied, 72 percent of small businesses remain uninsured, and premiums are about to rise by 15 to 20 percent after two years of decline.
The businesses that navigate this landscape successfully share a common characteristic: they treat cyber insurance not as a checkbox but as an integrated part of their security program. They implement the controls underwriters require, document those controls rigorously, and review their policies at least annually against the evolving requirements list.
For businesses that are unsure whether their current security setup qualifies them for coverage, or want to ensure their SSL certificate infrastructure and broader security posture are aligned with insurer expectations, the starting point is a documented security assessment against the eight core controls that carriers now consistently require.
Primary Sources and References
National Association of Insurance Commissioners (NAIC): 2025 Cybersecurity Insurance Market Report
IBM Security: Cost of a Data Breach Report 2025
Arctic Wolf: Cyber Insurance Market Maturity Research, August 2025 (via Help Net Security)
Swiss Re: Cyber Insurance Market Report 2025
Verizon: 2025 Data Breach Investigations Report (DBIR)
Aon: Cyber and E&O Claims Data 2024
Munich Re: Global Cyber Insurance Market Projections 2025
Allianz: Cyber Insurance Claims Analysis 2025
Fortune Business Insights: Cyber Insurance Market Size, Share, Growth, Trends Report 2034
Coalition: Cyber Insurance Underwriting Data 2024
Marsh McLennan: Cyber Insurance Market Report 2025
S&P Global Ratings: Cyber Insurance Premium Forecast 2026
Flashpoint Threat Intelligence: Credential Theft and Infostealer Activity H1 2025
Howden Insurance: Cyber Insurance ROI Analysis 2025
Sophos: State of Ransomware Report 2025
comparecheapssl.com is not a licensed insurance provider. This blog is for informational purposes only. Always consult a qualified insurance broker for advice specific to your business.